
Em. prof. dr. Jacques van Dinteren, Innovation Area Development Partnership (IADP)
Paul Jansen MSc, Arup / Innovation Area Development Partnership (IADP)
Mieke de Bruin MSc, Foundation Utrecht Science Park
Paper for the 41th IASP World Conference on Science Parks and Areas of Innovation. Nairobi, Kenia, 23-27 September 2024
EXECUTIVE SUMMARY
A good ratio of start-ups, scale-ups, and mature companies within a science park is crucial for promoting innovation, collaboration and economic growth. By balancing these different categories, science parks can create a vibrant ecosystem that encourages exchanging ideas, facilitates knowledge transfer, and provides opportunities for successful partnerships and investments. However, this research clarifies that no universally prescribed ideal ratio exists for these businesses in a science park. Several factors influence the optimal relationship between companies and institutions within a science park.
In search of the ideal mix
The Utrecht Science Park is hugely successful. With more than 30,000 employees, Utrecht Science Park is the largest science park in the Netherlands. Until 2040, a growth of 4,000 to 8,000 jobs is foreseen. For the short and long term, there is the question of how to distribute the spaces available at the Utrecht Science Park among the interested companies and institutions. In particular, this paper focuses on what a mix of start-ups, scale-ups, and larger companies should be aimed for (by the way, without ignoring the significance of universities and knowledge institutions). A quick scan of existing literature was carried out to answer this question. A compact survey was also conducted among science park managers worldwide.
A quick scan of the literature reveals no research findings on the ideal composition of companies in a science park (in terms of life cycle) and its effect on the functioning of the companies located there. However, there are generally shared insights on how start-ups, scale-ups, and mature companies influence each other within innovative ecosystems, such as science parks, incubators, and regional clusters. For example, start-ups often benefit from collaboration with mature companies and academic institutions. These collaborations facilitate the transfer of knowledge, experience, and technology, which can benefit start-ups’ growth and development. The start-ups often bring new ideas and perspectives, while mature companies offer economies of scale and operational efficiencies. Collaboration with mature companies can also protect from competition, and these companies can serve as excellent mentors. These studies conclude that a healthy coexistence of start-ups, scale-ups and mature companies in innovative ecosystems positively affects innovation, economic growth and employment. However, it gets a lot trickier when we want to find the ideal ratio between these firms.
Albahari (2019) has searched for the effect of the “ecology of tenants” in numerous publications. He argues that since space in a park is limited, selecting the most efficient businesses with the most significant growth potential is highly relevant. He argues that the ideal composition of businesses in a park is an important issue. An answer to this can help maximise the park effect. However, using available literature, Albahari notes that empirical evidence is lacking for an apparent effect of business composition on the performance of a science park. Nevertheless, several studies suggest that individual companies benefit differently from locating in a science park. Located in a science park seems more favourable for small companies when considering turnover, patents, and sales of innovations. In turn, larger firms benefit more than smaller firms from being located in a science park due to a substantial market share (Albahari et al., 2022).
From these studies, we could conclude that in terms of innovations and growth, smaller companies/start-ups and scale-ups benefit more from the working environment offered in a science park than large(r) or mature companies. The question arises as to whether starters and scale-ups can do without these mature companies. After all, there is a certain complementarity. Start-ups excel at creating successful proof of concepts , while established companies are much better at successfully scaling up proof of concepts (a Proof of Concept (POC) is the process by which you prove an idea is feasible. It is a screening phase to decide whether the idea can and should be brought to life. A POC can show that a great proposal on paper is not feasible and thus needs to be revised or discarded). Proximity makes it easier to cooperate. Benefits of co-location include the following:
- Knowledge transfer: proximity can facilitate the exchange of knowledge and expertise between start-ups and established companies. Start-ups can benefit from established companies’ industry experience and resources, while established companies can get fresh ideas and innovation from start-ups.
- Networking opportunities: co-location in innovation hubs or start-up clusters can provide access to a broader network of potential partners, customers, investors and mentors, increasing collaboration opportunities.
- Resource sharing: sharing physical space can lead to cost savings, such as shared office facilities, equipment and infrastructure, which can be especially useful for start-ups with limited resources.
- Talent pool: Being close to each other can make attracting and retaining top talent easier. Start-ups can attract entrepreneurial and innovative employees, while established companies have access to a pool of experienced professionals.
Survey results
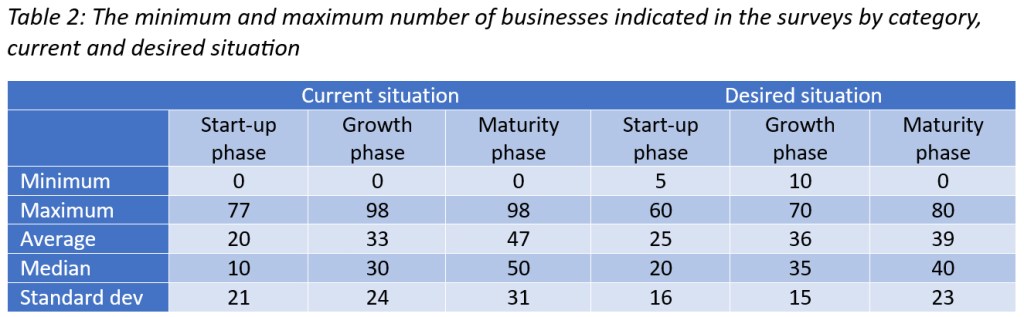
We gathered more insight into the ratio of start-ups, scale-ups and mature companies by conducting a compact survey (1 A4) among science park managers worldwide. Of the 160 questionnaires sent out, 40 were returned, of which 37 were usable (23%). Considering the number of forms received, the figures should be indicative. Outliers hardly occur in the dataset. However, the spread around the averages is significant (see below and Table 2). As mentioned earlier, this is already a possible indication of the heterogeneity of science parks.
It is important to note that the study focuses on the number of companies. During a pilot survey, science park managers could not answer questions about the relationship between the three distinct groups of companies in terms of floor space or number of employees.
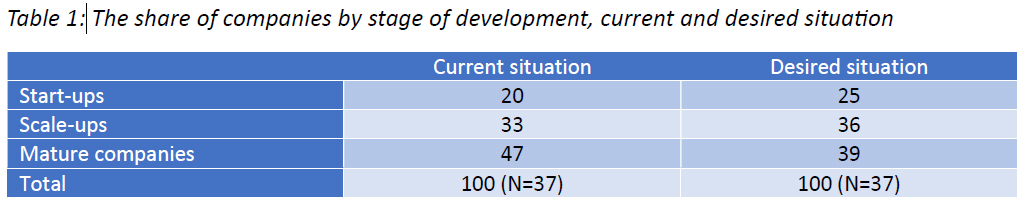
Almost half of the companies in the surveyed science parks are at the maturity stage (Table 1). Growers have a 33% share, and start-ups are the smallest group at 20%. Overall, this is not seen as the ideal situation by everyone. Ideally, there should be more start-ups and scale-ups in the science park at the expense of the established, mature companies. This provides a clear initial picture, but behind those averages are the figures for the different science parks (Table 2). There are not very large differences between the median and the mean. This means that the data are evenly distributed on both sides of the mean. However, we also note that the dispersion around the mean is large.
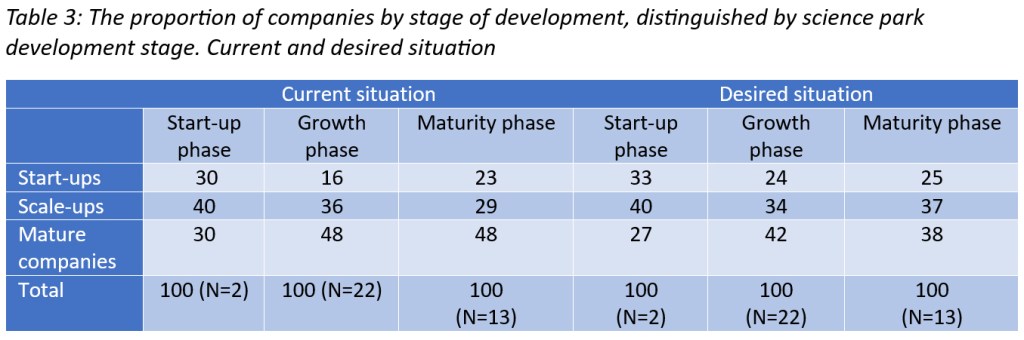
We can distinguish stages of development among the companies, but so can the science parks themselves. Two managers indicate that their parks are in the start-up phase. Those two parks are four and five years old. According to the managers, two parks are in the growth phase. These have existed for an average of 15 years (the spread ranges from 4 to 29 years). Thirteen parks are considered mature by their managers; on average, they are 29 years old (spread: 10 – 50 years).
As a park ages, the proportion of companies in the growth and maturity stages increases (Table 3). However, in the current situation, that ratio is not always the ratio envisioned by management. Science parks in the growth phase would have a larger share of start-up companies at the expense of mature companies. For mature science parks, growth companies would be allowed to have a larger share than mature companies.
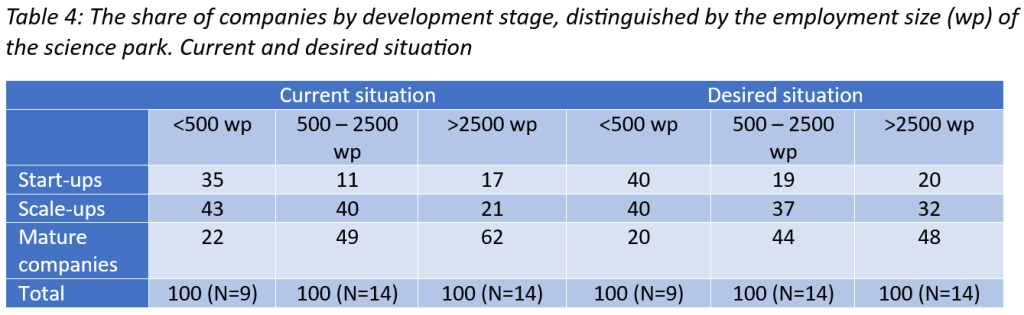
The figures obtained further indicate that the size of a science park, in terms of the number of jobs, affects the business composition (Table 4). The larger a science park is, the proportion of start-up companies decreases, and mature companies increase. Up to 2,500 people employed, scale-ups still have a share of around 40 per cent, but this is halved when the size exceeds 2,500 people employed. This is seen as less desirable by the managers of these large parks because, in the ideal situation, according to the managers, this share should have been one-third at the expense of the share of mature companies.
Finally, let us look at the age of the science park (Table 5). It could be assumed that the older sites have a higher proportion of mature companies, for example, due to a lack of advancement. This is not the case. On the contrary, the older sites have a more significant proportion of start-ups and significantly fewer mature companies. This is also a ratio between those three types of companies the management has in mind. The other two categories of science parks would prefer to have a bit more starters than is currently the case at the expense of the proportion of mature companies. This is especially true for the 11-15 category.

The above shows a substantial spread around the averages presented here. Previously, the literature review also revealed that science parks show substantial differences among themselves. An ideal mix, in terms of a certain percentage of starters, growers and established companies, cannot be determined; science parks are too heterogeneous.
However, the current composition of business activity is certainly not always in line with what the management has in mind. In general, the picture emerges that a more significant proportion of start-ups and scale-ups is often desired than in the current situation. In principle, the management of a science park can steer this through, for example, admission policy and real estate development aimed at specific types of users.
Considerations
The heterogeneity of science parks
One explanation for the differences in the relationship between start-ups, scale-ups and mature companies identified in the previous text is that individual science parks are all very different. Studies of science parks do not consider this sufficiently, which also explains why research findings often differ and contradict each other (Albahari, 2019). However, achieving a good ratio of start-ups, scale-ups, and mature companies within a science park is crucial for promoting innovation, collaboration and economic growth. By balancing these different categories, science parks can create a vibrant ecosystem that encourages exchanging ideas, facilitates knowledge transfer and provides opportunities for successful partnerships and investments. The previous makes it clear that no universally prescribed ideal ratio exists for these different types of businesses and institutions in a science park. Several factors influence the optimal relationship between companies and institutions within a science park. These include:
- The regional ecosystem: the regional context and existing industry clusters influence the composition of a science park.
- Objectives and focus areas: the objectives of a science park determine its composition. Some science parks may prioritise promoting innovation and entrepreneurship, while others may focus on collaboration with industry or the commercialisation of technology.
So, given the regional ecosystem, objectives and focus areas, each park management has to choose the preferred mix of companies and institutions.
Utrecht Science park
Underlying this research is the question posed by the Utrecht Science Park Foundation (The Netherlands) as to whether there is such a thing as an ideal company composition at a science park. Looking at the situation in the Utrecht Science Park (including Bilthoven), the park estimates that 66% of the total number of companies can be considered start-ups, 19% scale-ups and 7% mature companies. For the total of the science parks studied, these percentages are 20%, 33% and 47% respectively. The business population at Utrecht Science Park thus differs significantly from the averages for the total population surveyed, mainly due to the relatively large number of start-ups. Four other parks in the surveyed population have a proportion of start-ups of 60% or more. However, this is where the choice for a study based on absolute numbers of companies avenges itself, for, in this case of the Utrecht Science Park, the size of companies and institutions has a significant effect. If we look at the business structure at the Utrecht Science Park, it is striking that many large R&D companies and R&D institutions are located there. The Utrecht Science Park grew out of a concentration of several appealing knowledge and healthcare institutions. More and more R&D companies have gradually been added to these. Large successful R&D companies such as Genmab, GenDX and Merus also stem primarily from this ecosystem.
The amount of available physical space in Utrecht Science Park is currently limited. This makes it difficult to pay attention to attracting or facilitating the growth of mature R&D companies, which generally have more significant space requirements and are the most crucial target group for the Utrecht Science Park today. In time, redevelopment of the area, as also laid down in the environmental vision, will gradually create space for an additional 4,000 to 8,000 R&D jobs so that more space will also be created for more prominent (and park-specific) R&D companies.
The success of the Utrecht Science Park and the demand for space has now led to a two-track strategy. On the one hand, the park has opportunities for growth on the site itself, and on the other, park management is looking for expansion opportunities in the immediate vicinity. Such a regional strategy was initiated by Utrecht Science Park several years earlier with a study of possible expansion locations (Royal HaskoningDHV, 2016), later followed by the strategic cooperation with Poonawalla Science Park under the name of Utrecht Science Park Bilthoven. The TNO site in Zeist can also be added in the short term. This will make sufficient expansion space available in the coming years. All three locations may have a different mix, with the satellite locations focusing more on life sciences and sustainability-related production, such as the vaccine producer Bilthoven Biologicals in Utrecht Science Park Bilthoven.
Such a strategy assumes that a science park is not a stand-alone entity but is a focal point and centre of gravity in an innovative region. There are still such limited distances on a regional scale that interaction between companies and institutions is possible, whether located at a science park or not. Of course, the fact is that it becomes more challenging to know which companies and institutions located outside the science parks can add value to the regional ecosystem. This is the advantage of science parks: management is well acquainted with established companies and institutions and can play an essential guiding and stimulating role in strengthening the ecosystem.
At the same time, short distances also continue to play a role for certain companies. For example, this was why the National Institute for Public Health and the Environment (RIVM) chose to build new premises in the Utrecht Science Park. Because all the companies and institutions in the Utrecht Science Park (small and large) are R&D companies, there are numerous cooperation opportunities within walking distance for the RIVM.
Steering opportunities
The ideal mix does not exist, but based on specific characteristics of the regional ecosystem and particular objectives, the management of a science park does have several possibilities to steer the desired mix (which can, therefore, differ per sub-location). Consider the following:
- Provision of support infrastructure, such as dedicated equipment and prototyping facilities, accelerator programs, courses, networking events, investor events or identifying funding sources (grants, venture capital, loans) that attract start-ups and rapid scale-ups because they meet their specific needs.
- Supply of real estate. The scale of buildings and the maximum size of spaces to be leased can be used to prioritise the more small-scale businesses (which tend to be start-ups and scale-ups). The flexibility of real estate configurations, such as the ability to customise and aggregate spaces, can be attractive to growing companies that need customisable office and laboratory spaces. Offering co-working spaces can also attract start-ups and small businesses that need affordable workspaces and the ability to network with other businesses. Flexible leases, such as short-term leases and the ability to expand or downsize space, can help start-ups and growing companies adapt to changing needs.
- And, of course, the permitting strategy. It must be carefully aligned with the science park’s overarching goals and the local community’s needs. Management must consider the park’s long-term vision and economic and innovative goals to achieve and maintain the desired composition of activity. In the context of this study, an admissions strategy should look beyond a company’s position in the life cycle.
Literature
- Albahari A. (2019) Heterogeneity as a Key for Understanding Science and Technology Park Effects. In: Amoroso S., Link A., Wright M. (eds) Science and Technology Parks and Regional Economic Development. Palgrave Advances in the Economics of Innovation and Technology. Palgrave Macmillan, Cham
- Albahari, Alberto; Barge, Andrés; Salvador Pérez‑Canto, Gil and Landoni, Paolo (2022), The effect of science and technology parks on tenant firms: a literature review. In: The Journal of Technology Transfer (2023) 48: pp. 1489–1531.
- Royal HaskoningDHV (2016), Verkenning potentiële satellieten R&D en test-locaties Utrecht Science Park. Nijmegen.
